Taking a Measure of Sea Level Rise: Ocean Altimetry
From a ship, a plane, or the beach, the oceans can look pretty flat and uniform. But in reality, the water in the ocean piles up in peaks and valleys. It stands higher on some shores than on others. It can slosh around in ocean basins like the water in a bathtub. The surface of the ocean rises and falls naturally, varying as much as 2 to 3 meters (6 to 10 feet) in places.
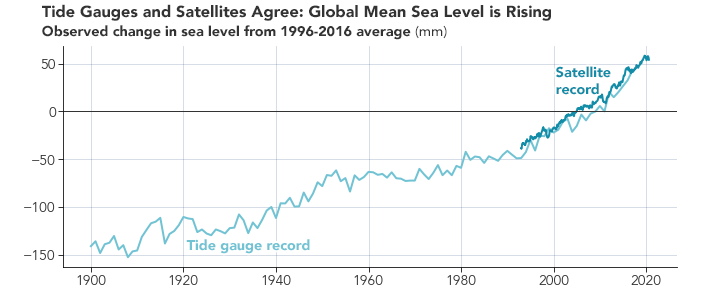
Scientists also know that the overall level of the sea has been rising around the world, and more in some places than others. They estimate that over the past 140 years, global mean sea level has risen 21 to 24 centimeters (8 to 9 inches).
Scientists have accounted for that, too. By analyzing sea surface data over long periods and noting the occurrence of major events like El Niño, they can identify and remove the natural cycles to spot the comparatively small changes in overall sea level. This is why radar altimeters are now in their fifth generation: they have collectively accumulated a data record that is longer than the seasonal, yearly, and even decadal cycles.
What scientists have found after all of that data gathering and cross-checking is that global mean sea level has risen a total of 95 millimeters (3.7 inches) since TOPEX-Poseidon first started flying in 1992. And the rate is accelerating. Over the course of the 20th Century, sea level rose at about 1.5 mm per year; in the early 1990s, the rate was about 2.5 mm per year. Over the past 30 years, the average rate has increased to 3.4 millimeters (0.13 inches) per year.
That total rise in seal level is a global average, and the numbers can be significantly higher in some places. (See the map at the top of the page.) For instance, researchers have observed that sea level along much of the East Coast of North America has been rising faster than the global average.
While a few millimeters of higher water may seem small, scientists estimate that every 25 millimeters (1 inch) of sea level rise translates into 2.5 meters (8.5 feet) of lost beach along our coasts. It also means that high tides and storm surges can rise even higher, bringing more coastal flooding, even on sunny days. Some estimates suggest seas could rise another 650 millimeters (26 inches) by the year 2100 if Earth’s ice sheets and glaciers keep melting and its waters keep warming.
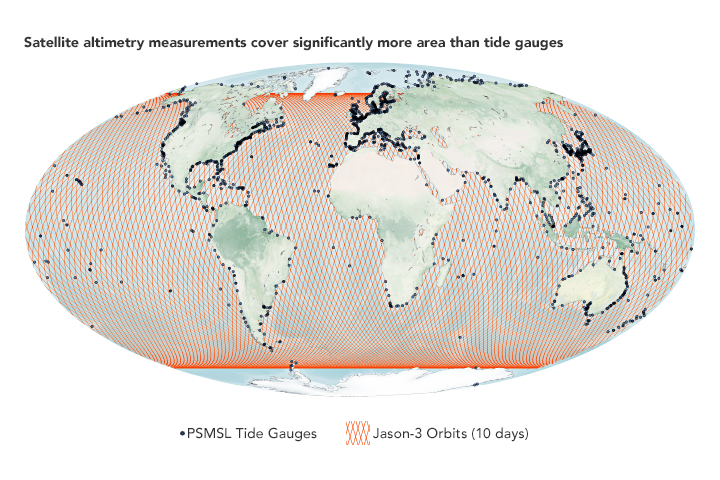
Ocean altimeters alone cannot tell us why seas are rising; other instruments and data sets are needed to tell us that. But together with tide gauges, these satellites tell us clearly that our planet is changing. And they help us see more clearly where that is happening.
NASA Earth Observatory images by Joshua Stevens, using TOPEX/Poseidon, Jason-1, Jason-2, and Jason-3 data courtesy of Ben Hamlington, NASA/JPL-Caltech, and tide gauge data from Permanent Service for Mean Sea Level (PSMSL). Video by NASA/JPL-Caltech. Story by Michael Carlowicz, with science interpretation by Ben Hamlington/NASA JPL, Richard Ray/NASA Goddard, and Josh Willis, NASA JPL.


No comments:
Post a Comment